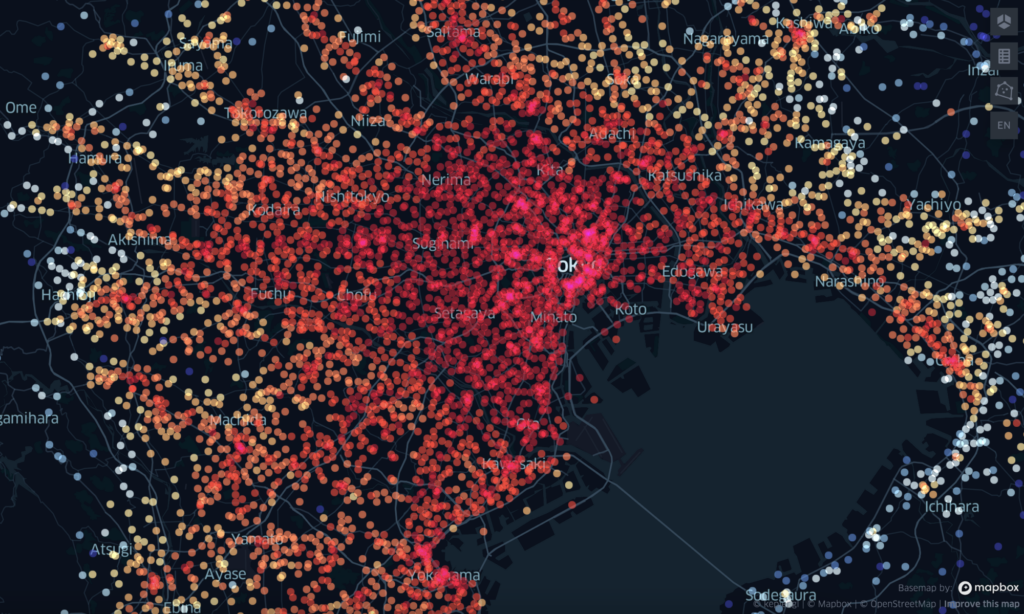
可視化データのサンプルをウェブサイトに掲載しています。
Visualize Image. データは2022年度の公示地価です。元々無料公開しているものですので自由にご活用下さい。少し重いので、クリックしてから暫くお待ち下さい。環境によっては数十秒ほどかかると思います。
現時点で、スマホは未対応です。
追記:8月2日軽量化作業完了しました。

データは、見て、かつ活用してこそ意味あるものです。
つまり、見せ方、活用のされ方を意識したデータの整備が必要となると思います。
(もっと言えば、データの取得の仕方も含めて)
このマップはkepler.glというオープンソースを利用し、geojson形式のデータ群を簡易にビジュアル化したものです。
※開発目的で、前置きなく不可視となる可能性がありますが、ご了承下さい。
※データは各々の責任において活用下さい。
公示地価マップは公表されているデータをそのまま表示しただけのものですが、「分析」を加えていくと、「意味のある」データになります。しかしその意味は意図的になってはならず、一定の客観性を保てるよう留意が必要です。
An image of the visualization data is available on the website.
The data is public land prices for the year 2022. The data is originally published free of charge, so please feel free to make use of it.
Data is meaningful only when it is viewed and utilized.
In other words, it is necessary to maintain data with an awareness of how to show and use it.
(More specifically, including how the data is acquired.)
This map is a simple visualization of a group of data in geojson format using the open source kepler.gl.
*Please note that for development purposes, the data may be invisible without any preliminaries.
Please use the data at your own risk.
The public land price map is just a display of the published data as it is, but when “analysis” is added, it becomes “meaningful” data. However, the meaning must not be intentional, and care must be taken to maintain a certain level of objectivity.
