Land Price Survey. 2021年から2022年の公示地価変動率を都市別に概観
RESOURCESページに2022年の公示地価データに基づいてビジュアル化した地図を掲載しています。
データ自体はオープンなもので、国土交通省のページで地図も含めて公表していますが、多少ビビッドカラーで表現し、高低のイメージを掴みやすくしています。
用途地域や建ぺい率、容積率など公表地点の情報もいくつか掲載しましたので、是非皆様の実務でご活用頂ければと思います。
公表データには前年度からの地価変動率情報も格納されていますので、主な都市についてビジュアル化してみました(掲載しているマップでは見られませんので、こちらでご紹介します)。
A visualized map based on public land price data for 2022 is available on the RESOURCES page.
The data itself is open and is published on the Ministry of Land, Infrastructure, Transport and Tourism’s website, including the map, but it is expressed in somewhat vivid colors to make it easier to get an idea of the highs and lows.
We have also included some information on the published locations, such as zoning, building-to-land ratio, and floor-area ratio, so we hope you will find this information useful in your business operations.
The published data also contains information on the rate of change in land prices from the previous year, so we have created a visual representation of the main cities (not available on the map, so please refer to it here).
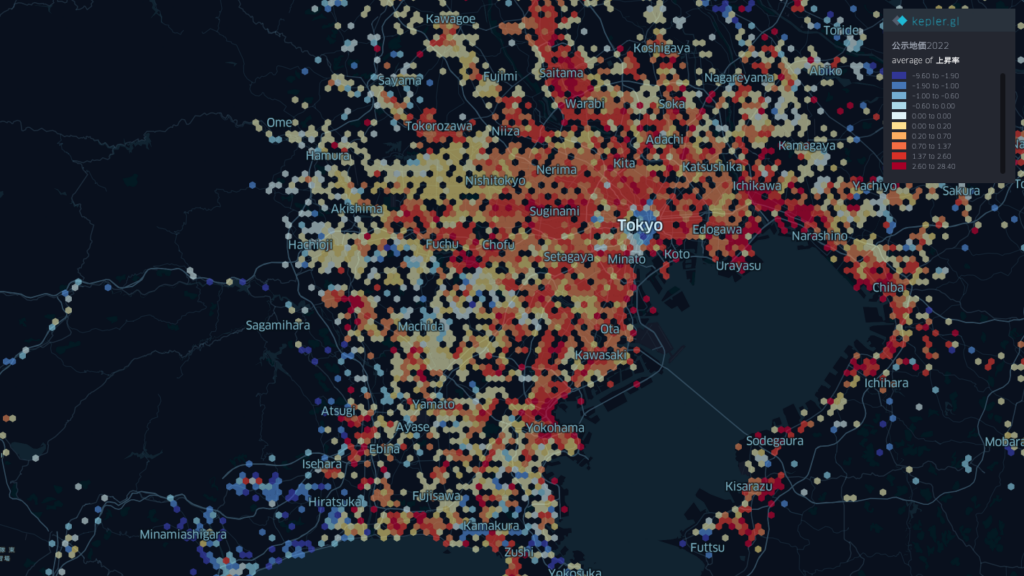
先ずは東京です。この六角形は0.5キロ単位で含まれるポイントでの地価変動率の平均値を取っています。
都心部では減少(青色)していますが、周辺は上昇しています。東京湾を囲み、横浜、浦安、船橋、千葉、市原、木更津と帯状に伸びています。
First is Tokyo. This hexagon shows the average rate of change in land prices at the points included in 0.5 km increments.
While land prices are decreasing in the central Tokyo area (blue), they are increasing in the surrounding areas. Surrounding Tokyo Bay, the area extends in a belt from Yokohama, Urayasu, Funabashi, Chiba, Ichihara, and Kisarazu.
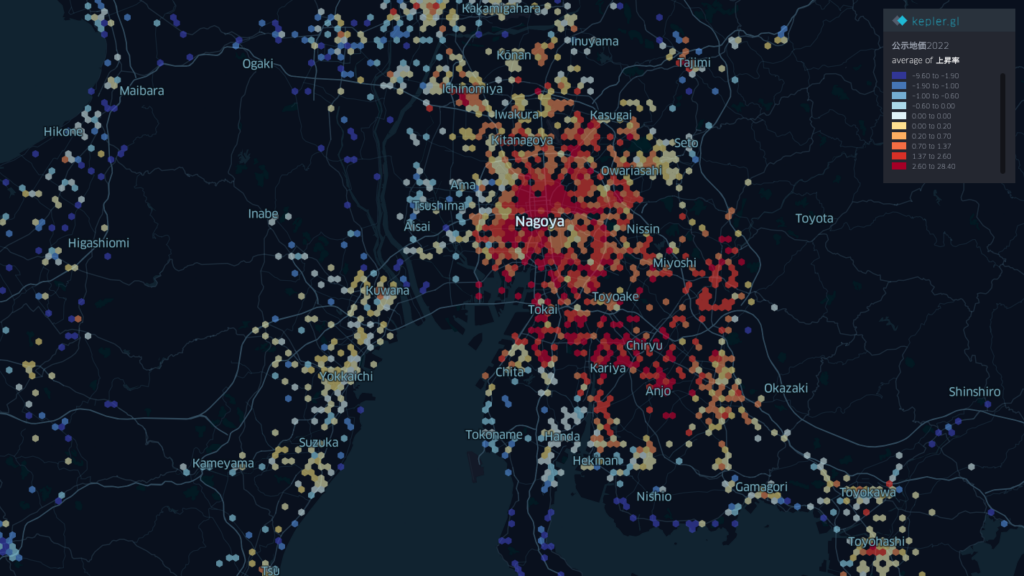
名古屋は都心部の沈下は見られず、面的に上昇傾向にあります。
Nagoya has not shown any sinking in the central part of the city and is trending upward on an areal basis.
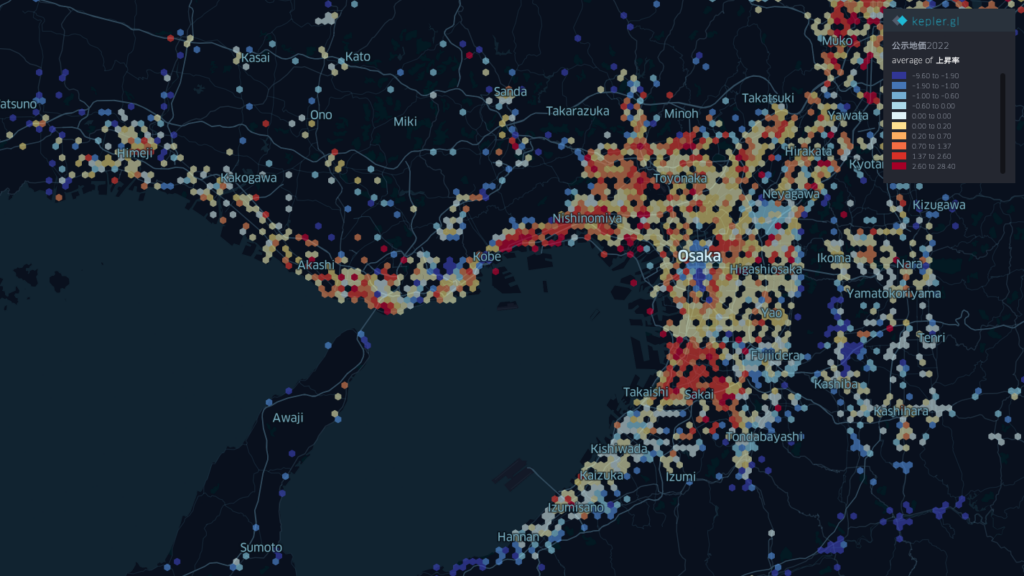
大阪は東京と同じように、都心部は沈下、周辺地域も大きな変化が見られません。
大阪都心部が伸び悩む中で、堺や神戸が伸びている事が分かります。
In Osaka, as in Tokyo, the city center is sinking and the surrounding areas are not showing significant change.
While the central Osaka area is stagnant, Sakai and Kobe are showing growth.
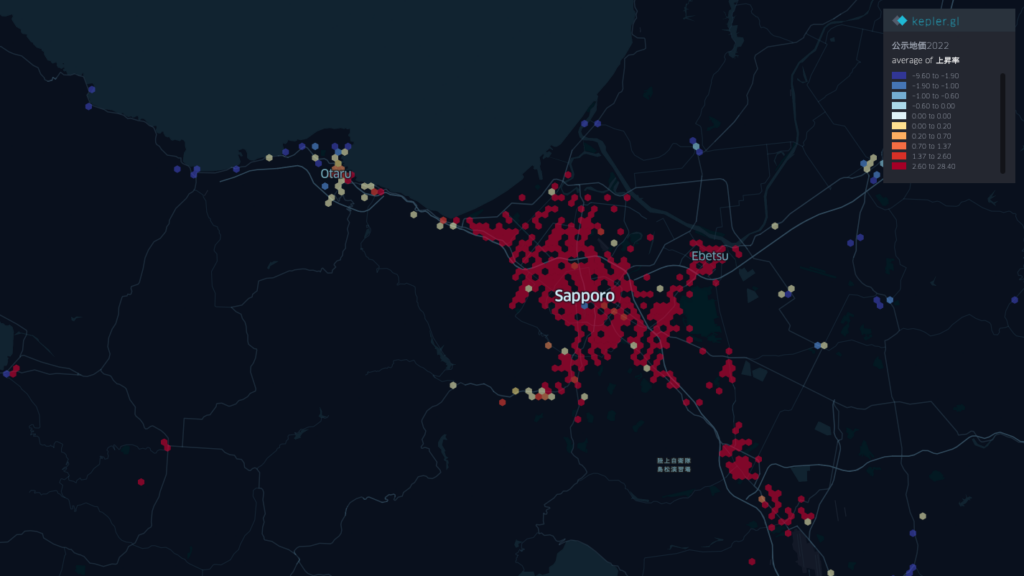
地方都市に目を移しますと、札幌は全体的にかなりの伸びを示しています。勢いがあります。
Turning to regional cities, Sapporo is showing considerable growth overall. There is a lot of momentum.
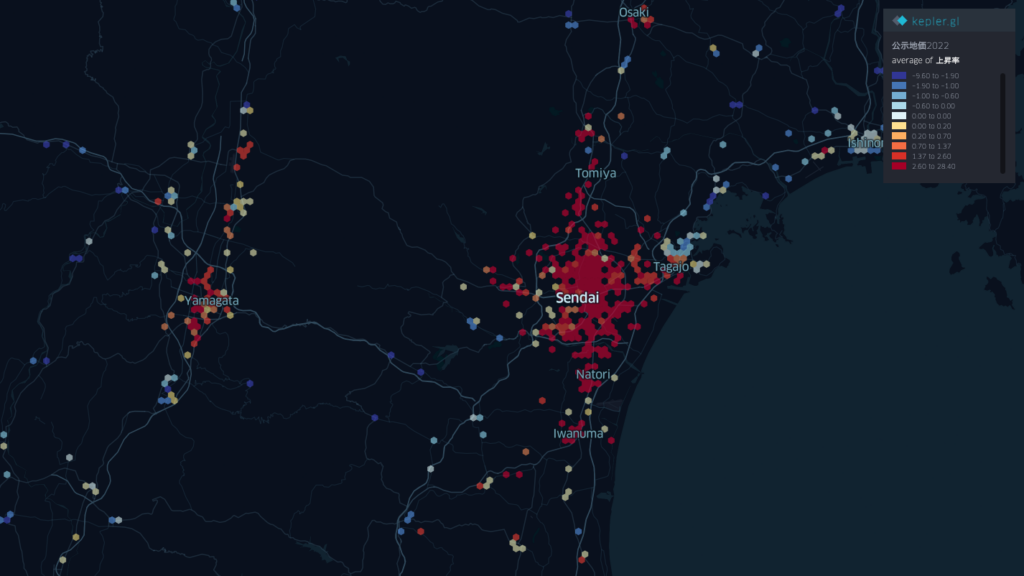
仙台も真っ赤です。復興の勢いから更に上昇しているように見えます。
Sendai is also bright red. It appears to be rising further from the momentum of reconstruction.
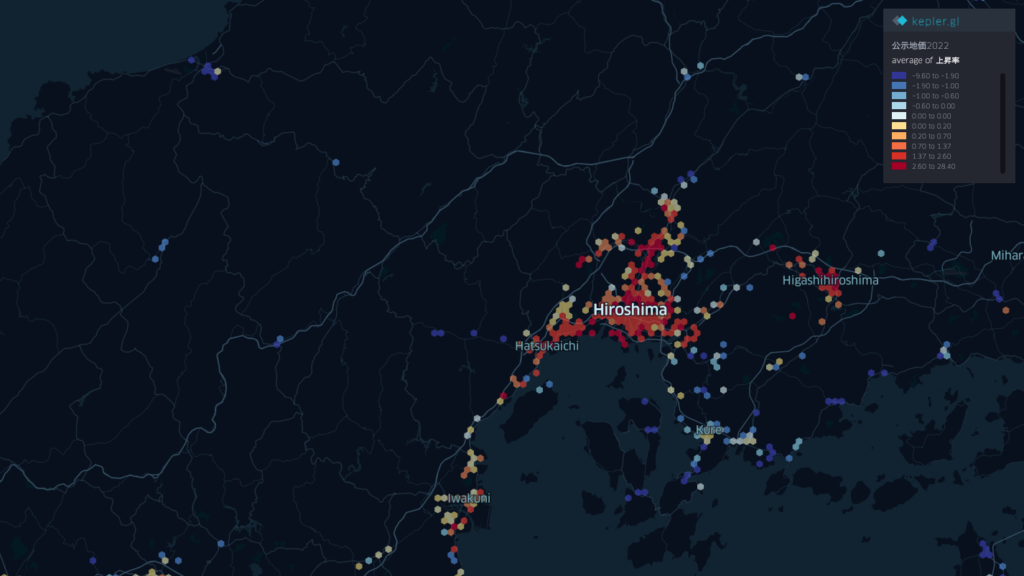
広島市も全体的に上昇しています。
Hiroshima City is also rising overall.
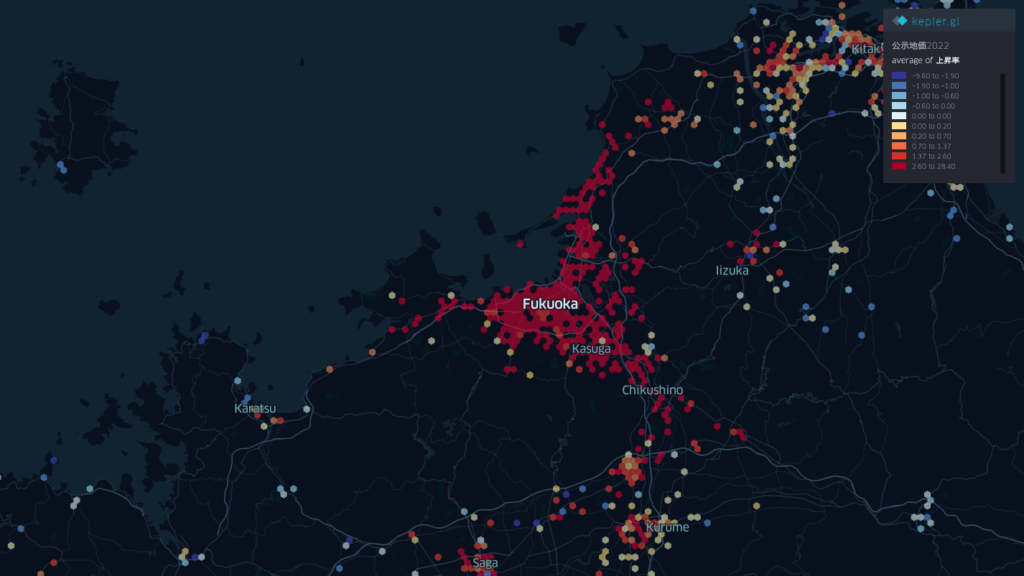
福岡の勢いはデータでも明らかです。
仙台や札幌などもそうでしたが、今、地方の大都市が伸びています。
簡単なデータのご紹介でしたが、こうして見てみると、ニュース等で伝えられる内容が、視覚的に裏付けられる形になります。国土交通省のデータは過去数年分の同じポイントの地価データも格納されており、年度ごとの変化を見ていくのも面白いと思います。
Fukuoka’s momentum is evident in the data.
As was the case with Sendai and Sapporo, regional metropolises are now growing.
This was just a brief introduction to the data, but when you look at it this way, it visually confirms what is reported in the news and other media. The Ministry of Land, Infrastructure, Transport and Tourism also stores land price data for the same points for the past several years, so it would be interesting to see the changes from year to year.
